
Draft Debt Bulletin April 2024
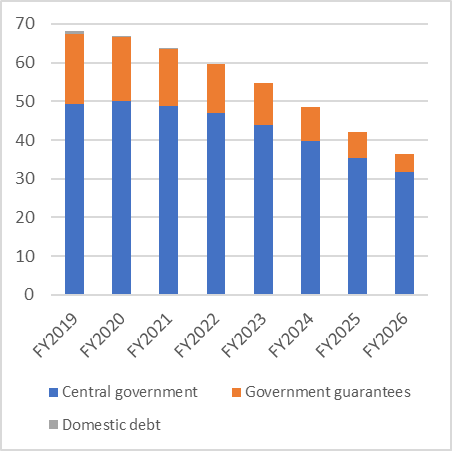
As of March 31, 2024, total public debt stood at US$54.7 million or equivalent to 19.5 percent of GDP.
Statistical Bulletin August 2023
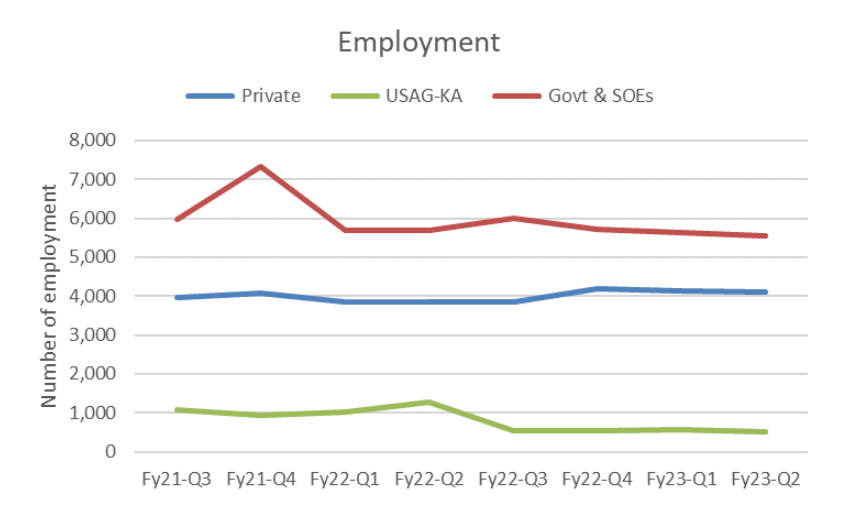
In the second quarter of fiscal year 2023, employment levels in both private and public sectors have been stable. The total employment in USAG-KA remain…
RMI Stats Bulletin Jan 2023
Private sectors employment has been increased consistently but dropped from 3,928 to 3,922 in Q3(FY22). Public sector employment increased sharply in Q4(FY21) reaching a peak…